Hey — Tom here.
You know that sinking feeling when your boss asks you to "present the findings" to the leadership team?
Your palms get sweaty. Your mind goes blank.
Suddenly, all those charts and insights you've been working on feel like a foreign language you're about to butcher in front of the people who matter most.
Here's the thing:
Data presentations aren't about showing off your technical skills.
They're about telling a story that drives action.
And once you nail the fundamentals, confidence follows naturally.
What you'll learn this week:
- The 3-step framework that turns any data analysis into a compelling narrative
- Why most data presentations fail (hint: it's not all about chart selection - but that does matter!)
- How to handle the dreaded Q&A session without tripping yourself up
- The one thing your audience actually care about when you're presenting data
How to Present Data Confidently in 3 Simple Steps
Let's be honest — most data presentations are terrible.
They're packed with jargon, drowning in charts, and leave everyone more confused than when they started.
The presenter clicks through 47 slides of technical waffle while the audience mentally checks out after slide 3.
Don't be that person.
The good news?
Confident data presentation isn't about being the smartest person in the room. It's about being the clearest.
Here's my 3-step framework that works every single time:
Step 1: Start at the End
If you met your friend for coffee and they ask, "How was your weekend?"
You wouldn't start with "Well, first I woke up at 7:23 AM, then I brushed my teeth with a medium-bristle toothbrush..."
You jump straight to the good stuff: "I went to X for food" or "I watched Y on TV".
Data presentations work the same way.
Your audience doesn't care about your methodology, your data sources, or how many hours you spent cleaning the dataset.
They want to know: What did you find, and what should we do about it?
Start every presentation with your key finding.
Make it impossible to miss:
"Sales are down 23% because we're losing customers in our most profitable segment."
"Our new marketing campaign generated £2.3M in additional revenue."
"This bottleneck is costing us X hours every week."
Lead with the punchline. Everything else is supporting evidence.
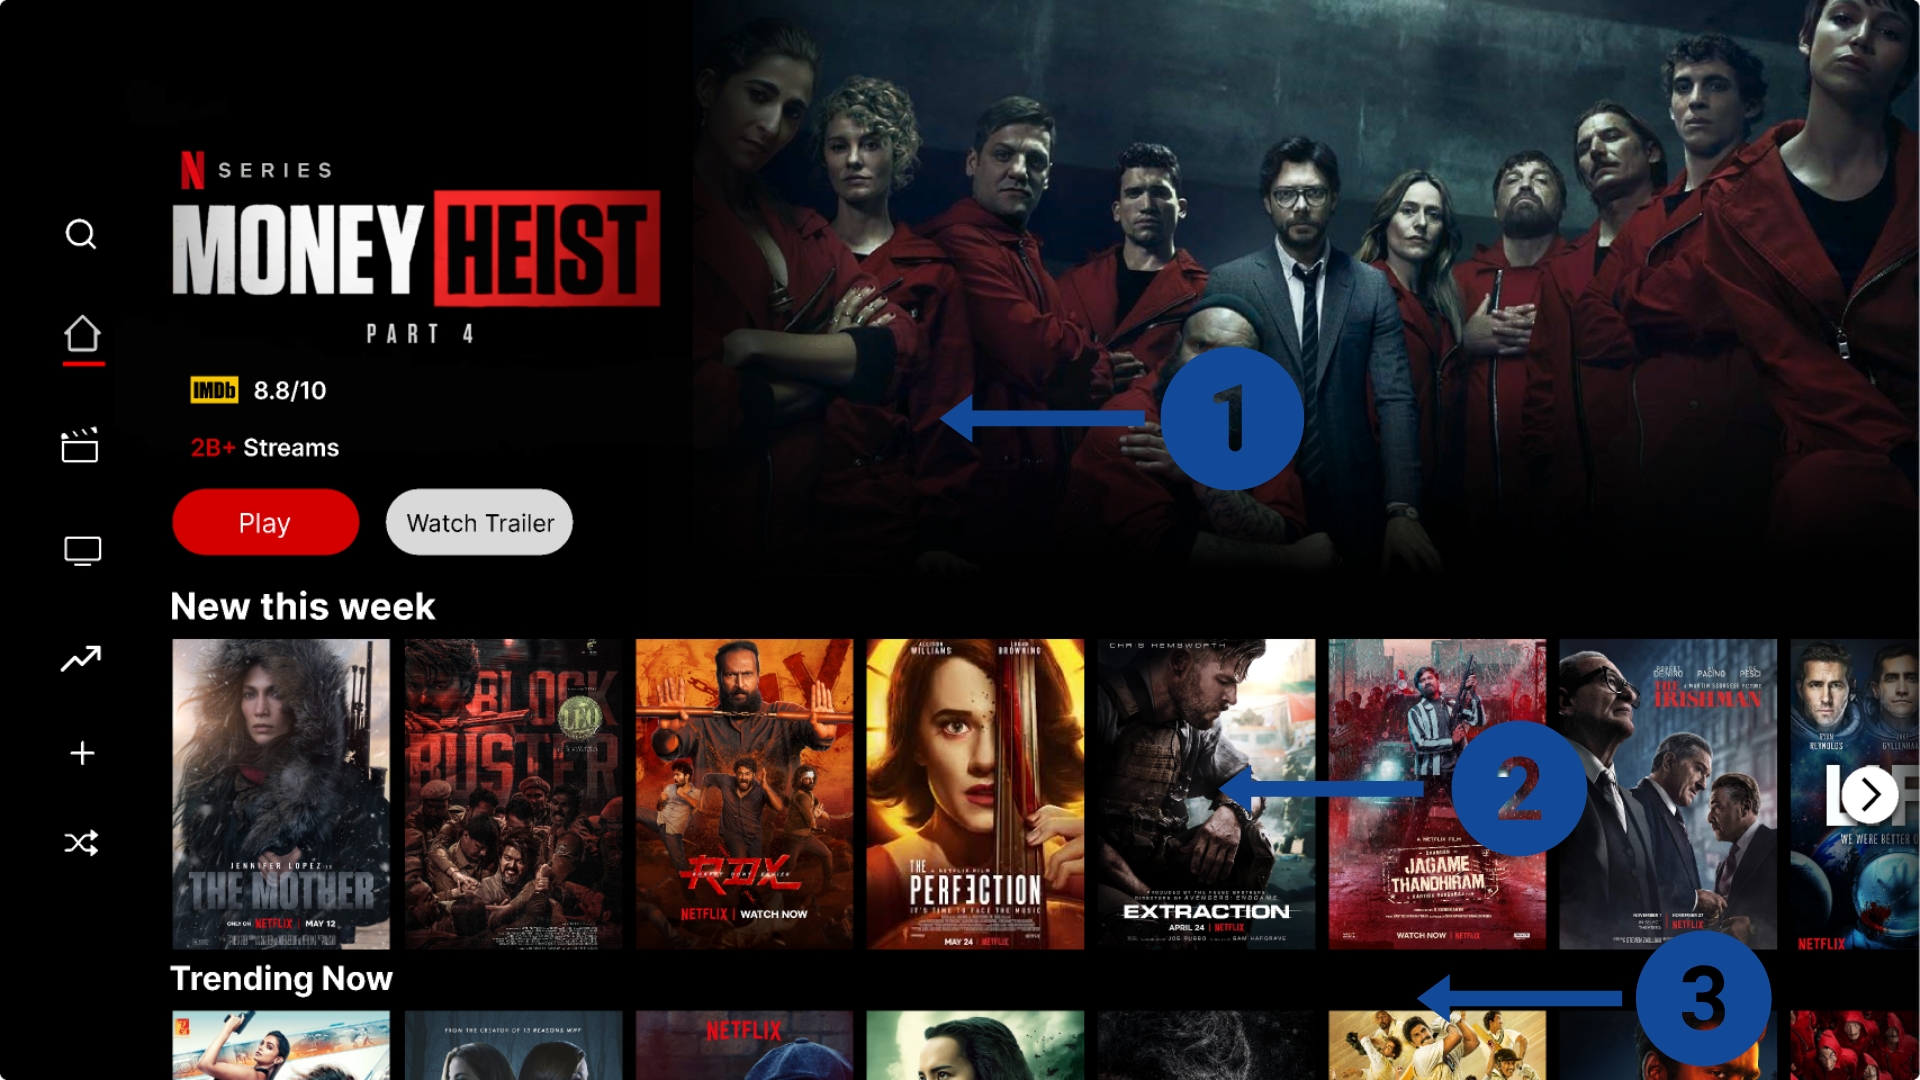
Step 2: Follow the Netflix Rule
You know how Netflix shows you exactly 3 things when you land on the homepage?
The #1 promo, the "new this week" list underneath that, and trending now recommendations.
Not 47 options.
Just 3.
Your brain can only process about 3 key points in any presentation.
After creating/studying hundreds of data presentations, I've noticed a pattern:
The most successful ones follow the Rule of 3.
- 3 main insights
- 3 supporting charts
- 3 recommended actions
Here's why it works:
When you try to say everything, you say nothing.
When you focus on 3 core messages, people remember them.
Your audience will thank you for respecting their time.
Step 3: End With One Clear Ask
This is where most presentations die a slow, painful death.
You've delivered your insights brilliantly.
The audience is nodding.
Then you get to the end and mumble something like, "So... um... any questions?"
Wrong.
Every data presentation should end with one crystal-clear request:
"I need approval to hire 2 additional analysts."
"We should pause the current campaign and reallocate budget to Channel B."
"Can we schedule a follow-up next week to discuss implementation?"
Notice these aren't vague suggestions like "we should explore this further" or "this requires additional analysis."
They're specific, actionable requests that give your audience exactly one decision to make.
Think of yourself as a consultant, not a reporter.
Consultants get paid to recommend actions.
Reporters just share information.
Which one do you want to be?
Caveat: Sometimes further exploration/analysis IS needed. But when this happens, take the lead and explain: What you/your team is going to do next, and when your audience can expect to hear from you again.
TL;DR
- Start with your conclusion — tell them what you found before explaining how you found it
- Stick to 3 main points — your audience's brain can't handle more than that
- End with a specific ask — make it impossible for them to ignore your recommendation
- Remember: You're not showing off your technical skills, you're driving business decisions
Theory doesn’t land jobs or get you promoted. Implementation does.
Inside Premium this week, you’ll get exactly what you need to present data like you’ve worked in industry for 10+ years:
-
3x PowerPoint templates — fill in with your analysis, land your message in a fraction of the time, and get senior leaders on your side.
-
The Stakeholder Q&A Preparation Framework — bulletproof your analysis before the tough questions start.
-
How to Choose the Right Chart Cheatsheet — never make the wrong visual choice again.
And that’s just the start.
Plus, you unlock £400+ in ready-to-use resources:
-
Data Dictionary Builder (£99 value)
-
Executive Data Storytelling Slide Deck (£149 value)
-
Data Salary Negotiation Scripts (£199 value)
-
Full access to the entire archive of past editions (including SQL datasets & code, how to create a "mini" data-warehouse project and more!)
Take advantage of everything I’ve learned in the last 8+ years working in data — and get the exact frameworks I use to transform nervous analysts into confident decision-drivers.
You’ve got this. Give it a go.
— Tom